Quality Intelligence
ReportsOverview
The Quality tab tracks defect trends across the project — how many defects are being raised per sprint, how severe they are, whether bugs are escaping testing, and which open defects have been sitting unresolved the longest. It helps quality engineers and project managers spot systemic quality issues before they compound.
KPI cards
| Card | What it shows |
|---|---|
| Total Defects | All defects logged in the project across all sprints and statuses. |
| Open Defects | Defects that remain unresolved. The sub-label shows how many of those are Critical severity. |
| Defect Leakage | Average percentage of defects discovered after development was marked complete. Lower is better — high leakage means quality issues are escaping testing. |
| Avg Defect Density | Average defects raised per sprint. Target is under 3 per sprint. |
Charts
| Chart | How to read it |
|---|---|
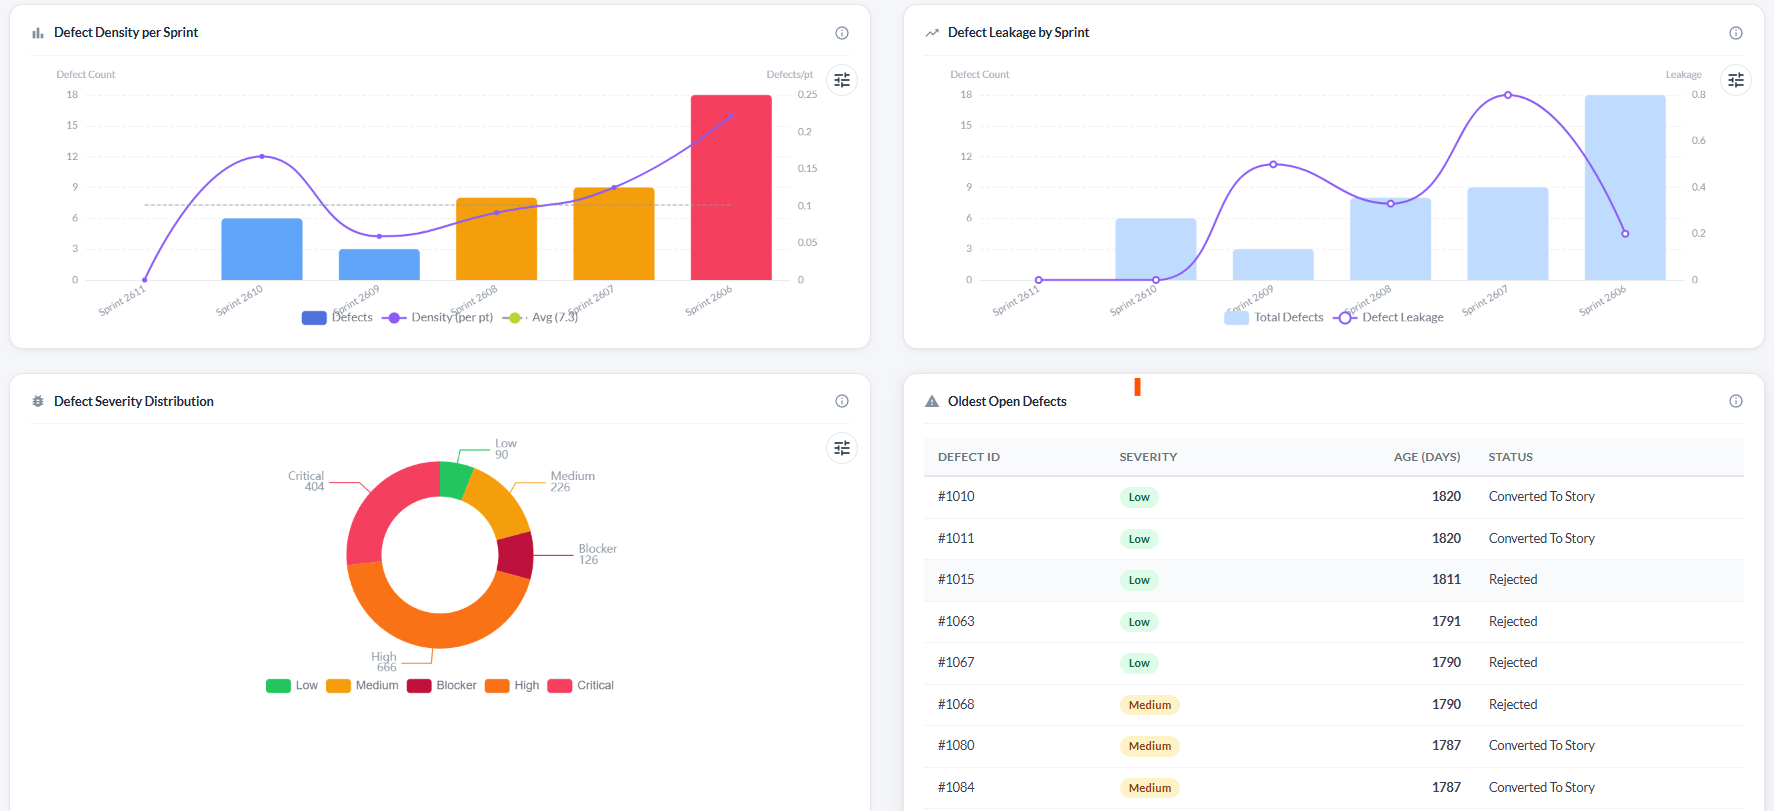
| Defect Density per Sprint | Dual-axis chart. Bars show raw defect count per sprint — colour-coded (blue = below average, amber = above average, red = 1.5× above average). The purple line shows defect density as defects-per-delivered-story-point. A dashed average line is overlaid. Target: below 0.5 defects per point. |
| Defect Leakage by Sprint | Dual-axis chart showing total sprint defects (bars) and the number that escaped to the next stage (purple line). Rising leakage indicates that testing is not catching bugs before stories are accepted. |
| Defect Severity Distribution | Donut chart grouping all open defects by severity: Blocker, Critical, High, Medium, Low. Hover a segment for count and percentage. |
Oldest open defects table
Below the charts, a table lists the ten oldest open defects sorted by age. This surfaces stale issues that may have been forgotten.
| Column | What it shows |
|---|---|
| Defect ID | ID of the open defect. |
| Severity | Colour-coded severity badge. |
| Age (days) | How many days the defect has been open. Red > 30 days (stale), amber 15–30 days (needs attention). |
| Status | Current defect status. |
Troubleshooting
Defect Density shows zero for all sprints
Defect density is calculated from defects linked to stories in completed sprints. Make sure defects have been created and are associated with stories in closed sprints.
The Severity Distribution donut is empty
No open defects exist in the project, or all defects have been closed. This is a good sign — if the chart should have data, check that defects have not been accidentally closed.
The Oldest Open Defects table shows items I thought were fixed
A defect only leaves the table when its status is set to Verified or Closed. If the fix has been deployed, open the defect and update its status.
Defect Leakage is always 0
Leakage is calculated from defects found after a linked story was accepted. If no stories have been formally accepted in the sprint, leakage will be 0.