Predictability
ReportsOverview
The Predictability tab answers the question: how reliably does this team deliver what it commits to, and how long will it take to finish the backlog? It combines commitment reliability history, scope creep analysis, and a Monte Carlo simulation to give data-driven delivery forecasts at different confidence levels.
KPI cards
| Card | What it shows |
|---|---|
| Commit Reliability | Average percentage of committed story points delivered on time. Green ≥ 80%, amber 60–79%, red < 60%. |
| Avg Scope Creep | Average percentage of unplanned work injected into sprints relative to original commitment. ≤ 10% is acceptable. |
| P50 Forecast | Monte Carlo result: 50% of simulated runs complete the remaining backlog within this many sprints. |
| P85 Forecast | Monte Carlo result: 85% of simulated runs complete within this many sprints. Recommended date to commit to stakeholders. |
Remaining backlog slider
Above the Monte Carlo chart there is a slider labelled Remaining backlog. Drag it to adjust the number of story points remaining (10–500). The simulation recalculates immediately — use this to run "what if" scenarios: if we descope 50 points, when do we finish? Click Reset to return to the actual backlog figure from the project.
Charts
| Chart | How to read it |
|---|---|
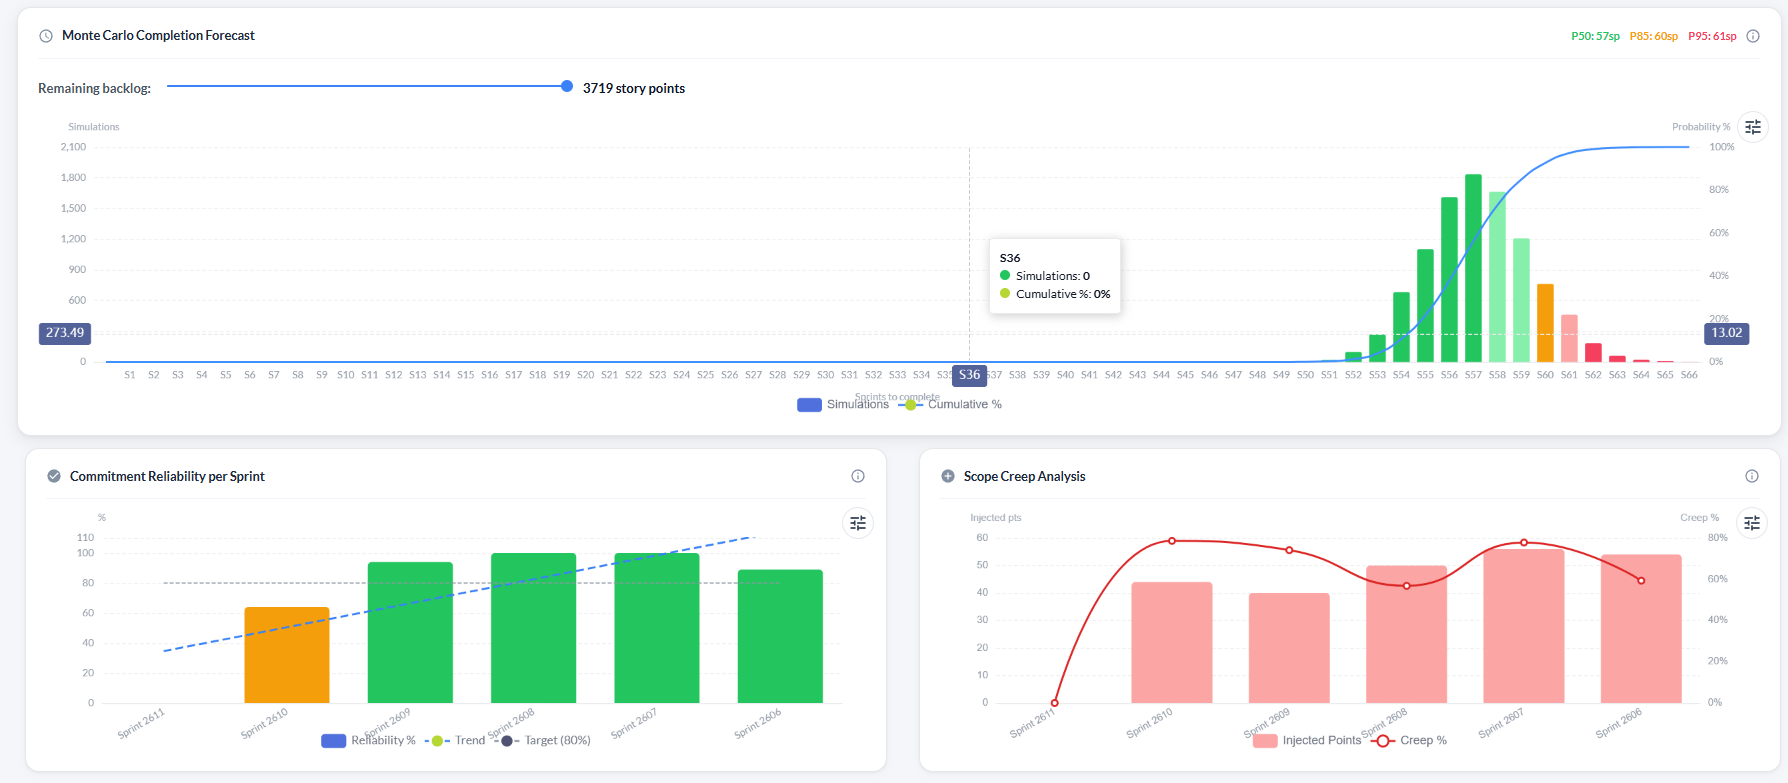
| Monte Carlo Completion Forecast | Runs 10,000 sprint simulations using historical throughput to estimate how many more sprints are needed to finish the remaining backlog. The histogram shows the distribution of simulation outcomes. The cumulative probability line (blue) rises from left to right — read off any sprint number to see the probability of finishing by then. P50 (green), P85 (amber), and P95 (red) confidence lines are marked. |
| Commitment Reliability per Sprint | Bar chart showing the reliability percentage (accepted ÷ committed × 100) for each sprint. Colour-coded per bar: green ≥ 80%, amber 60–79%, red < 60%. A dashed trend line and an 80% target line are overlaid. |
| Scope Creep Analysis | Dual-axis chart. Bars show the raw injected story points per sprint. The red line shows scope creep as a percentage of the original commitment. ≤ 10% is acceptable; 10–20% is a watch signal; > 20% is at risk. |
Troubleshooting
The Monte Carlo chart is empty
The simulation requires at least 3 sprints with completed story points. Complete more sprints to enable the forecast.
The P85 forecast shows a very large number of sprints
The forecast is based on historical throughput. Low average velocity combined with a large remaining backlog will produce a long forecast. Use the remaining backlog slider to test different scenarios.
I adjusted the backlog slider but the forecast didn't change
The forecast recalculates automatically when you drag the slider. If the chart doesn't update, try refreshing the page — the slider state may have desynchronised.
Commitment Reliability shows 100% for some sprints but the team clearly missed work
Reliability is calculated as accepted ÷ committed. If stories were carried over without being un-committed from the sprint, the committed figure stays the same and reliability will be overstated. Ensure unfinished stories are removed from the sprint before closing.